Solving the most challenging Telecom defects orders of magnitude faster:
Even with the wide selection of software tools, agile processes and debugging methods available, networking companies are shipping products with known defects.
These are the complex defects that are often intermittent, take hours or days to manifest themselves, and often require large scale, and thus expensive topologies, in order to reproduce. So, instead of delaying a product’s general availability (GA) for an indeterminate amount of time awaiting a fix, networking organizations must ship the product, hope that the defect is not seen in the field, and continue to work on a fix in the background. This doesn’t include the unknown defects that are only detected in the field in unique customer installations, which are not only expensive to fix but have direct effects on the customer and put revenues at risk.
What if engineers could record the failure as it happens - whether in Dev, QA or in the field? What if they didn’t have to waste time trying to mimic the error, continually adding logging or printfs, hoping that the failure occurs soon and that they added enough logging this time around?
Existing tools and techniques absolutely have their place in analyzing and solving defects. There are tools to catch common errors such as memory leaks, multiple attempts to free the same memory, CPU bottlenecks, etc. There are testing tools to elicit errors, such as traffic generation, fuzz testing, or stress testing. And there are tools that attempt to log events so they can be replayed, such as packet capture/replay. However, none of these capture everything that happened at the source code level, which would allow engineers to directly answer the question “What happened in the code to cause this failure?”
Instead, we’re so often reduced to repeated brute-force cycles of adding logging and printfs, rebuilding, restarting, waiting for the failure, and hoping we logged enough information to narrow down the problem.
Undo is working with the world’s largest hardware and virtualized networking companies; and every one of them tells us of defects that take weeks or months to solve, typically impacting the customer’s network in the meantime.
Undo’s Live Recorder captures everything that happens at the source code level and saves the data in a recording file. Engineers can then use the recording to repeatedly debug and analyze exactly what happened during the failure, in the absence of the hardware environment, without waiting for the failure to happen again.
Undo’s Live Recorder has been proven with extremely large, multi-threaded, multi-core, shared-memory applications such as SAP HANA and complex EDA simulation tools from Mentor Graphics and Cadence Design Systems. Live Recorder is currently being used to record and debug hardware- and virtual-based Network Operating Systems with the world’s largest networking companies.
CONTINUOUS CONTAINER SECURITY WITH AUTOMATED POLICIES:
WhiteSource for Containers never misses a beat, providing secure management of your container images and containers with continuous security monitoring in CI servers, container registries, during run-time and on Kubernetes.
Our advanced integration enables you to enforce your WhiteSource policies automatically throughout the container lifecycle in order to block vulnerable components from entering production, initiate automated workflows, and get real-time alerts on security and compliance issues.
NATIVE SUPPORT FOR CONTAINER REGISTRIES:
WhiteSource for Containers offers native integrations for Docker Hub, Amazon ECR, Azure Container Registry, Google Cloud Registry, and JFrog Artifactory. The ontroller scans container images including the file system, installed packages, image layers, and handled archive files, to detect security and compliance issues, enforce policies, initiate workflow and support the remediation process.

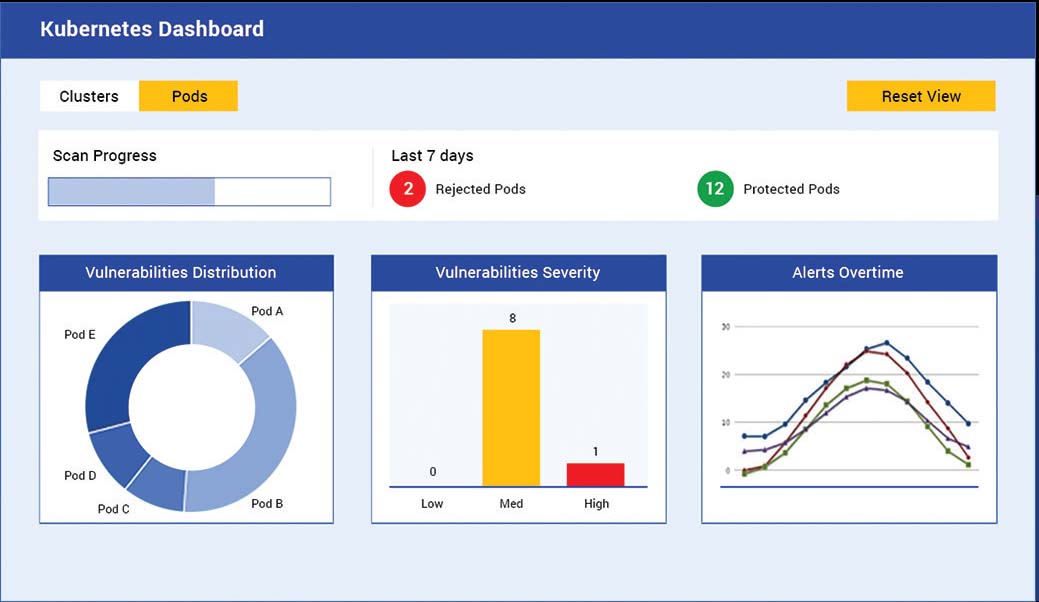
FULL CONTROL OVER KUBERNETES CONTAINER ORCHESTRATION
The WhiteSource Kubernetes Controller is a designated lightweight pod located inside your Kubernetes cluster. It detects all open source components in your cluster and alerts on issues as per your organizational policies.
The Controller supports all Managed Service Providers (AKS, EKS, and GKE). Our solution also tracks changes (e.g. new deployment or image modifications) to detect new vulnerabilities.